
How we Built our your Own Technology Radar
In this post I show how we built our own technology radar and you can do the same using AI agents and N8N.
 A “technology radar” is a strategic tool to help you systematically monitor and assess emerging trends. While it’s traditionally thought of as something only big companies do (see inspiration section), we’ve found it’s just as valuable for startups, especially in fast-moving fields like AI.
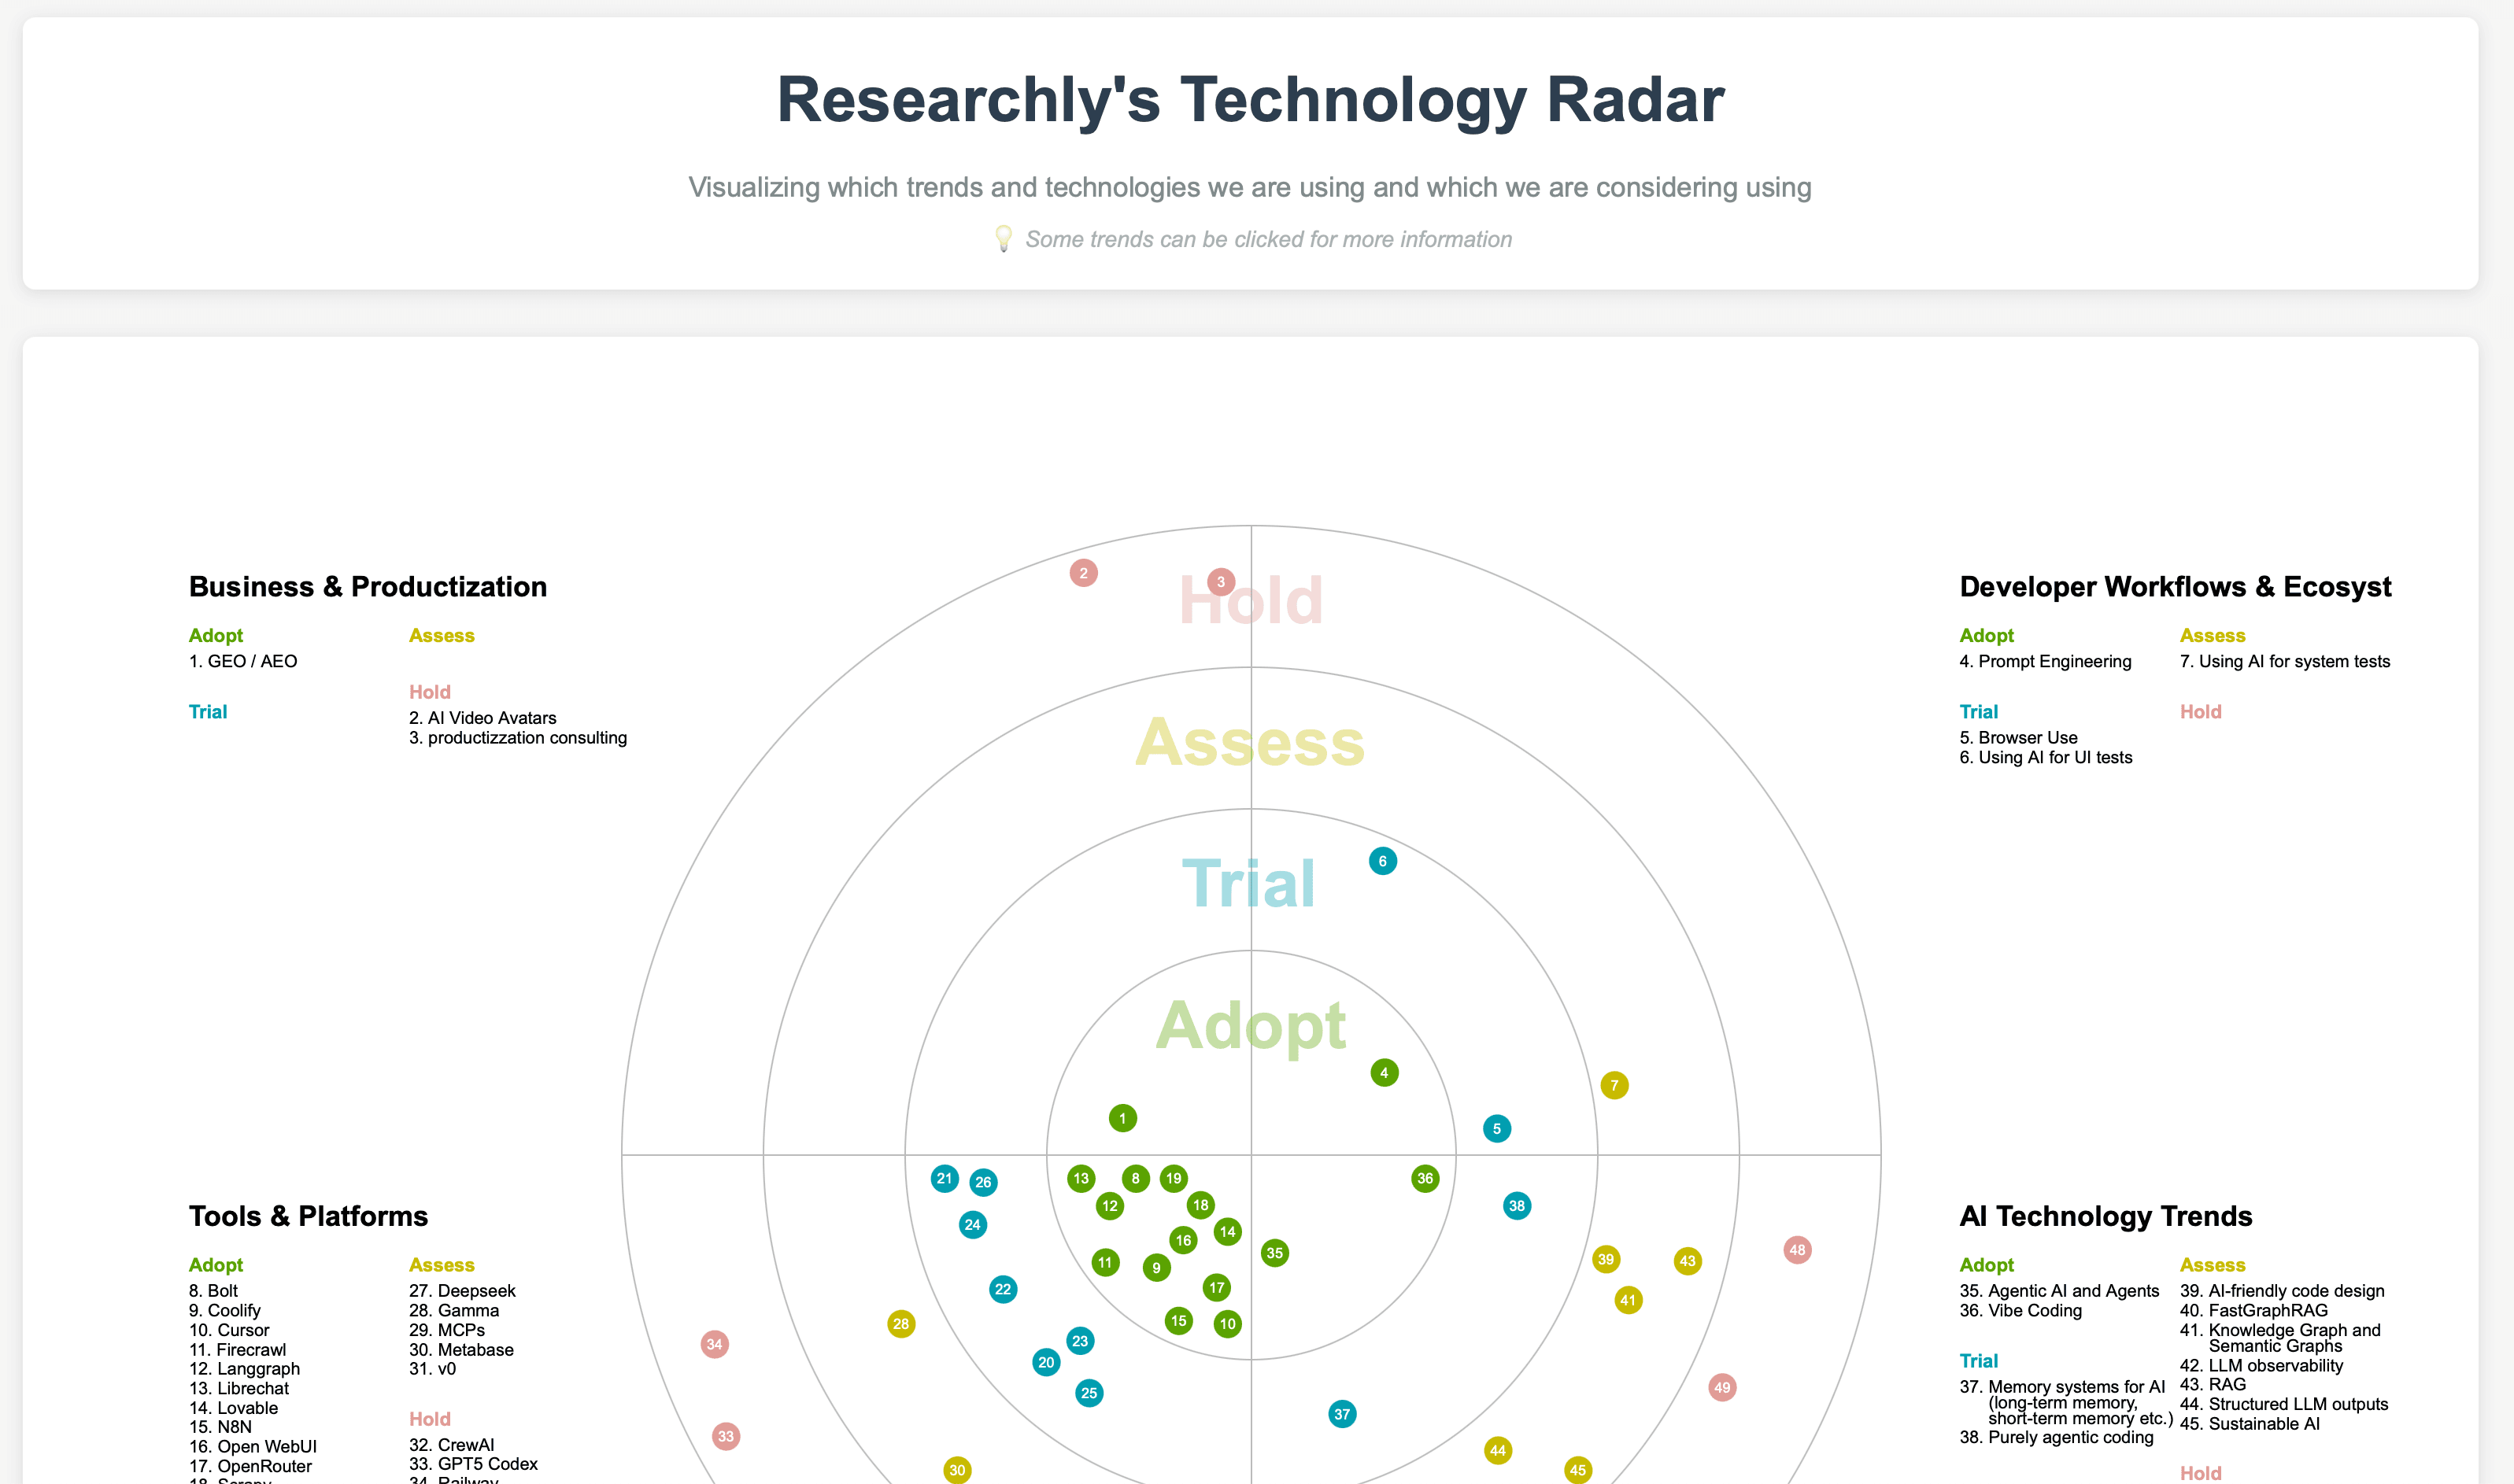
Thus, we developed our own. You can take a loot at our technology radar here. Below I have documented how we did it and you can build your own technology radar. We built it ours using Researchly, but below we are sharing an N8N workflows that helps you accomplish a simpler version.
Identify the Trends You Want to Track
First, you need a list of trends.
- In our case, we were already tracking most relevant topics, so we just collected them into this Google Sheet.
If you don’t already have such a list, try:
- Brainstorming (even with ChatGPT or another AI assistant)
- Web searches for “trending X” in your domain
- Internal communication mining: If you have access, scan through Slack, email threads, or Discord for repeated mentions of new ideas/trends
An Alternative: Reverse Trend Search
Normally, you write down known trends and assess their impact. But there’s also value in searching broadly for anything that might affect you—even topics outside your usual bubble (think patents, new research). This is trickier and fuzzier, but can uncover unique angles others aren’t seeing.
Define Trend Categories
Once you have your list, you’ll need to group the trends into big-picture categories, depending on your context. A “trend” can be technical, business-related, social, etc.
Our categories:
| Category | Description |
|---|---|
| AI Technology Trends | Advances in AI and adjacent fields |
| Tools & Platforms | Frameworks, SaaS, libraries enabling AI & dev workflows |
| Business & Productization | New business models, enterprise usage, consulting trends |
| Developer Workflows & Ecosystems | How developers build/test/interact with AI and tools |
We automated this step in N8N, which lets us easily categorize new trends as they emerge. You can find the workflow at the end of the post.
Define Your Scoring (Assessment) Dimensions
To assess each trend, we look at it from several angles. For us, the main dimensions are:
- Impact: How much value could this trend bring? (productivity, revenue, compliance, etc.)
- Adoption / Maturity: How widely is it currently being used or explored?
- Risk: How big are the security, compliance, or ethical risks? How hard would implementation be?
You can adjust these dimensions to fit your business or industry. For large corporations legislature, for instance, is a frequent dimension.
Identify Your Sources & Gather Evidence
To track each trend, we look across various sources. For us, great sources include:
- Social Media: Reddit, Twitter/X, LinkedIn (has a lot of self-promotion, bubble-like content, but a lot of gems too)
- Github often has open-source projects which are very far ahead of the curve
- Academic Papers: arXiv, Semantic Scholar
- Patents: Espacenet, Google Patents
- Financial reports: Earnings calls, SEC filings (especially for public companies, unicorns)
- News & Industry reports: Especially useful for understanding market impact
Gather Evidence for Each Trend & Dimension
Here’s where you connect each source to each trend + dimension. For automation, you might use web search prompts like:
- “Show evidence from Reddit about market adoption of AI agents”
- “What does LinkedIn say about the risks of open-source LLMs this week?”
Template:
“Give me data from <source> regarding the <dimension> of <trend>.”
Organize all your evidence per trend and per dimension—tracking the source is essential, so you can connect specific news or signals to your scoring later.
We use Researchly for that, but you can do a first version manually in Google Sheets and N8N, linking to every piece of evidence you collect. See template at the end.
Score Each Trend & Dimension with a Scorecard
Now that you have evidence, it’s time to assess each trend using a consistent scale (we use 1-5). For each dimension, write out what kind of evidence corresponds to which score. For example, for Impact:
| Score | Meaning |
|---|---|
| 1 | No clear impact/barely any credible evidence |
| 3 | Quantified improvement in case studies, pilots (“15% more X”) |
| 5 | Widely validated by benchmarks or meta-studies; industry standard |
Do this for each dimension—this is what keeps your radar systematic instead of subjective. Again, N8N automation was our helper here.
Calculate Overall Scores & Place Trends into “Radar Rings”
After scoring, you can sum or weight the scores to get an overall score per trend. This lets you place each trend in a “ring” on your radar.
Example Radar Rings:
- 3–6: HOLD (Monitor—don’t act yet)
- 7–9: ASSESS (Evaluate more closely)
- 10–12: TRIAL (Try on a small scale or pilot)
- 13–15: ADOPT (Strongly recommend; make part of your product/process)
Put your most promising trends in the center and your less mature/less relevant ones on the periphery.
8. Keep Your Radar Current
Tech moves fast! We refresh our radar every week with an automated workflow and track changes and underlying reasons.
9. Make Adoption Triggers Explicit
For each trend, it helps to write down what would need to happen for you to actually adopt it. For example:
- What are the blockers (e.g., maturity, compliance, skills needed)?
- Which concrete metrics would tip the scales? (e.g., “Two competitors successfully launch a product…”)
Making these “trigger conditions” explicit helps you reevaluate trends methodically as circumstances change.